
H/TIP
http://www.isthereglobalcooling.com/
Welcome to my website where I will try to give you the answer to the question “is there global warming?” As you are well aware there is a huge effort around the globe to counter the alleged impact of mankind on the world’s climate. If in fact mankind will cause the seas to rise appreciably by causing CO2 induced global warming then certainly let’s do something about it. But, what if global warming is not what they say it is? What if the world’s temperature is headed in the opposite direction? Global temperatures increased for twenty years from the late 1970s to the late 1990s but have actually been cooling the last eleven years. The global warming and subsequent cooling were even predictable due to hundreds of years of historical trends and observation of the impact of variations in solar activity on global temperature.
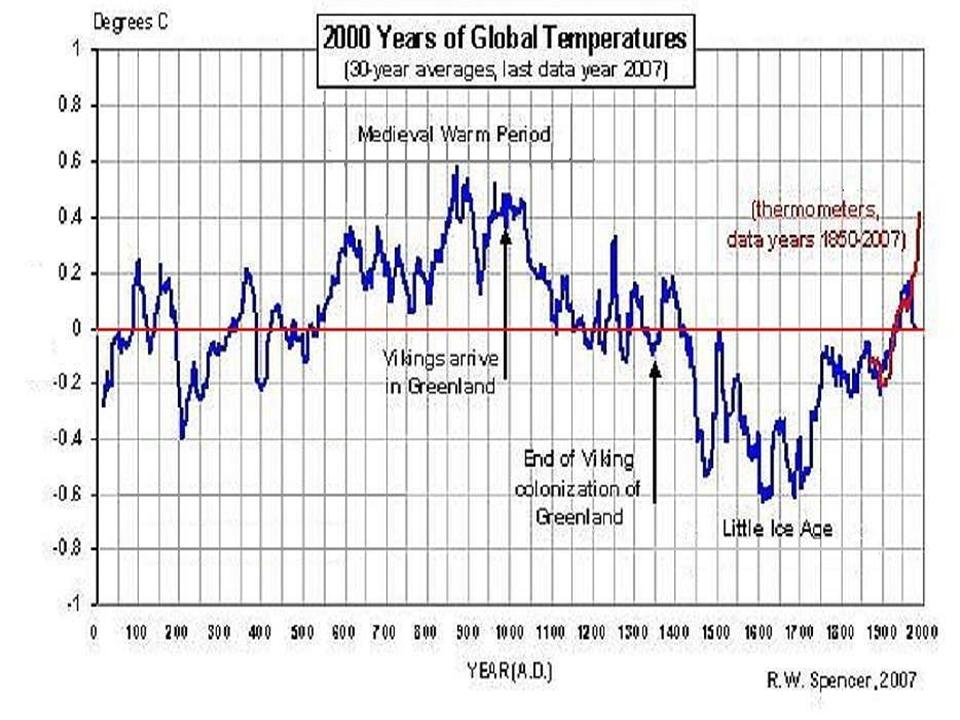
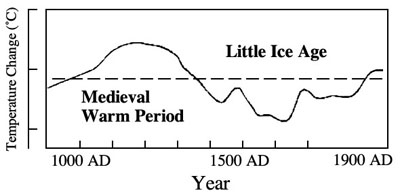
Did you know that the Roman Period and Medieval Period were both several degrees warmer than today’s temperature. The world then cooled at least four degrees from 1450 to 1850. This period was called the Little Ice Age (a period of glacial advance, the same glaciers that are in retreat today). These temperature variations were not caused by man. They were caused entirely by natural forces.
Quick facts about the US and global climate
*October 2008 to January 2009 temps were well below normal link According to the NCDC U.S. temperatures in October 2009 was on average the third coldest in 116 years, November was the 4th coldest, and February 2010 was the 29th coldest. U.S. temperatures December ’09 – February ’10 were well below normal link. UK experiences coldest May temps in 15 years link U.S. temps Nov ’09 to May ’10 remain mostly below normal link , October ’09 through March ’10 was the snowiest on record in the northern hemisphere link
*NASA GISS announced that 2008 global surface temperatures were cooler than 2007, the coolest since 2000 and below the average of the last 30 years.
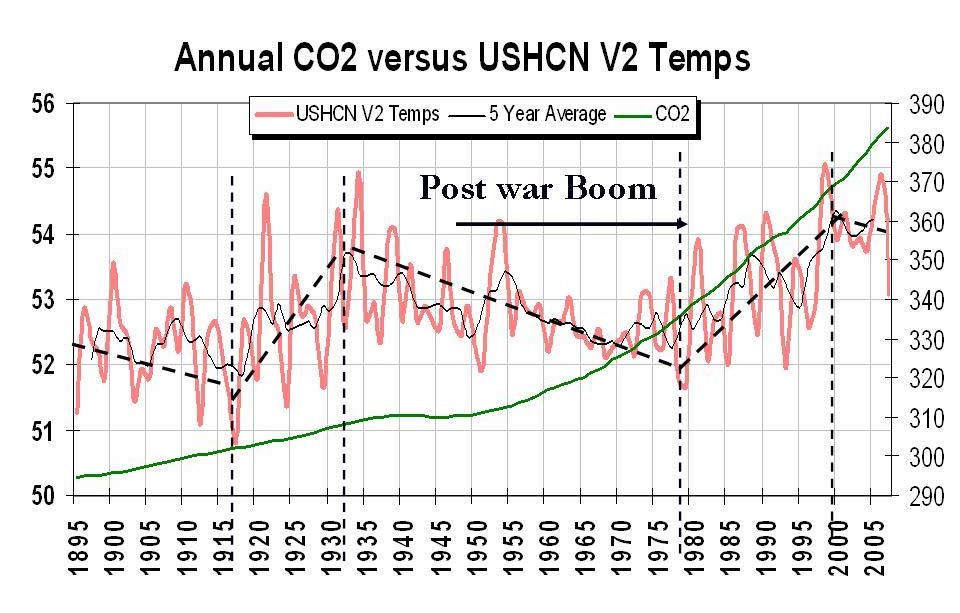
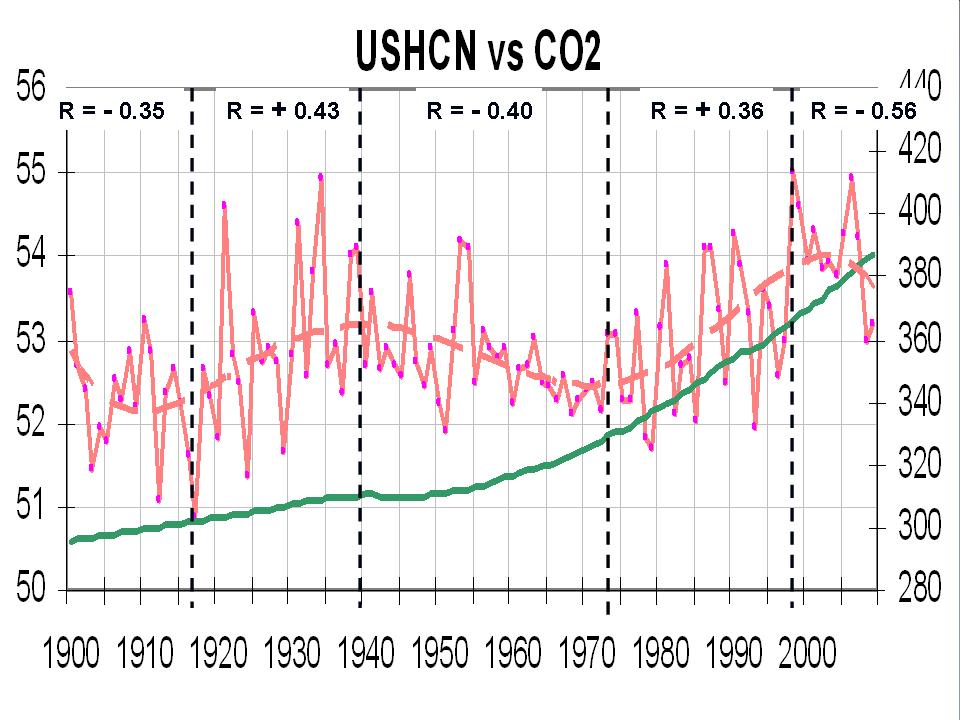
*In the U.S. temperatures cooled in five of the last seven decades even though CO2 levels increased steadily throughout this period. link link
*In February 2010 the Northern Hemisphere had the second largest area of snow coverage ever recorded link and North America had the most snow cover ever recorded. Snow coverage in the Northern hemisphere has been growing since 1998 link. Snow in areas where it usually does not snow can only be because temperatures are colder, and not from global warming link The additional snow was not because of higher levels of humidity, according to NCDC February ’10 was the 47th driest in 116 years.
July 2010, South America experiences historic cold weather link Argentina experiences coldest winter in 40 years link
Record Summer 2010 cold in Australia link
Cold weather kills 600 rare Penguins in South Africa link
In spite of all the hot weather of late, according to NOAA 62% of the continental U.S. had below normal temperatures January-July 2010 link
August 2010, hundreds die in Peru from record cold link October 2010, hundreds of thousands of sheep die in New Zealand from winter weather link
Early December snow (2010) impacts millions in Europe link Denmark experiences coldest November 2010 temps in 131 years link Sweden braces for coldest November 2010 temperatures in over 100 yearsl link UK midlands expect coldest November temps in 134 years link
The central England temperature record in early December 2010 was the second coolest since records began in 1649 link
The best and most accurate way to measure global temperatures are from satellites that measure atmospheric temperatures. See how atmospheric temperatures have changed since the start of measurement in 1979 link
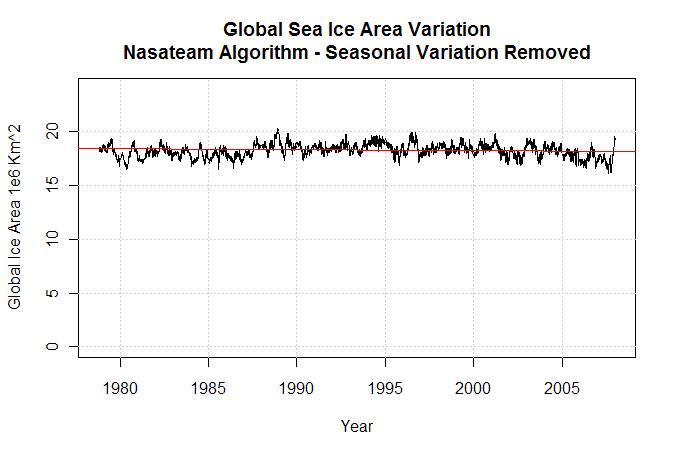
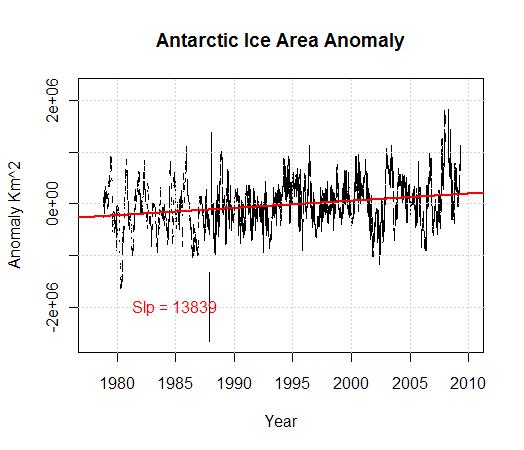
Total global polar sea ice extent is largely unchanged over the past 30 years
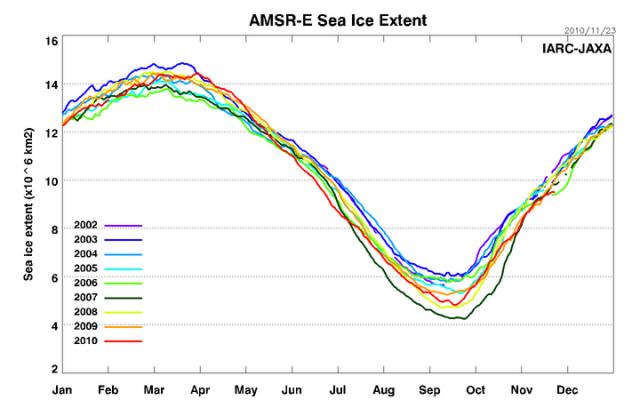
*When adding the sea ice volumes at both poles there is about the same ice as 30 years ago link. Antarctica has 90% of the world’s ice and had the most sea ice ever recorded at the end of 2008, over one million square kilometers above the average maximum. The global sea ice extent today (combined sea ice at both Poles) is nearly the same as the average of the last 30 years according to NASA and NSIDC link link View today’s Antarctic sea ice extent compared to the 1979-2007 average (National Snow and Ice Data Center) link link While it is true Arctic sea ice volumes have been overall slightly less today than the average of the last 30 years the ice there has been growing the past several years and as of mid September 2009 there was 24% more ice than just two years earlier, which is over 1 million square kilometers of new ice since 2007. There is also substantially more multi year ice in the Arctic in 2009 than just one year earlier link Antarctic sea ice extent in September 2009 is also growing and is 1 million square kilometers more than the previous year. In 2009 the Antarctic had the most Summer ice ever recorded link. The 2010 Arctic sea ice melt has started later than at any time ever recorded. Arctic ice volumes in April 2010 are the largest in nine years and are now close to the average of the last 30. link. View today’s Arctic sea ice extent, AMSR-E link NSIDC link (Nansen) link DMI link
2010 Antarctic ice extent was the third largest ever recorded. Average snowfall in Antarctica was the most ever recorded link
See current ice conditions in the Northern Hemisphere link and the Southern Hemisphere link
The Arctic ice concentration (total density) in early July 2010 is the highest in satellite history link
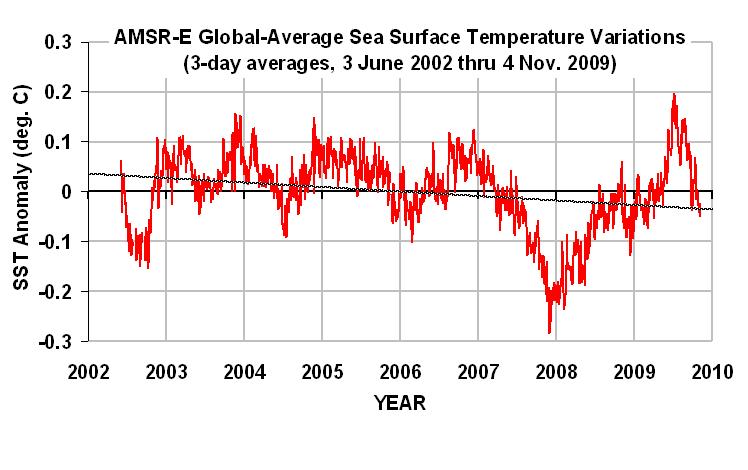
Ocean temperatures are cooling
Global storms and their intensity are in decline
*Violent tornadoes are in decline in the US link. U.S. landfall hurricanes are less numerous and powerful than decades ago link. Global hurricane, typhoon, and cyclone activity are nearing 50 year lows according to Florida State University link link Deaths from severe weather events are in decline link
Global cyclone activity is at 33 year lows at the end of the 2010 hurricane season. Pacific storms lowest since recording began in 1945. link
There have been few hurricanes to reach US shores in the past three years which is highly unusual link
Polar Bear populations are of record size
Some say Polar Bears are threatened but there are more polar bears today than ever recorded, an increase of 300%+ since the 1950s. link link The scientific name for Polar bears is Ursus Maritimus, which means sea bear. Polar Bears are excellent swimmers and can swim 200 miles or more link. Polar bears have survived periods when the Arctic melted completely in the past (they moved to land).
Solar activity is lower. This has led to cooler temperatures in the past
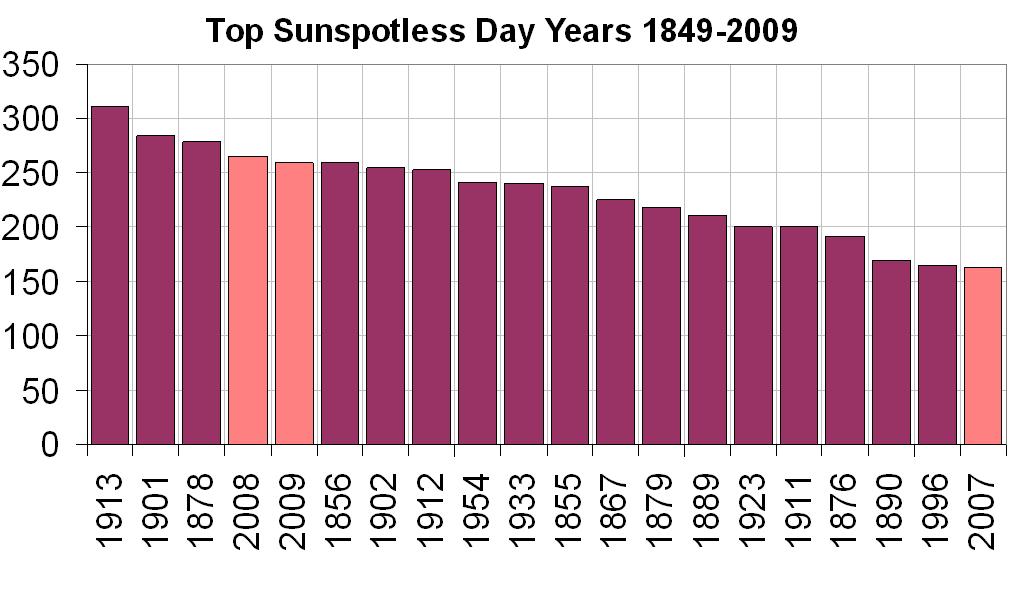
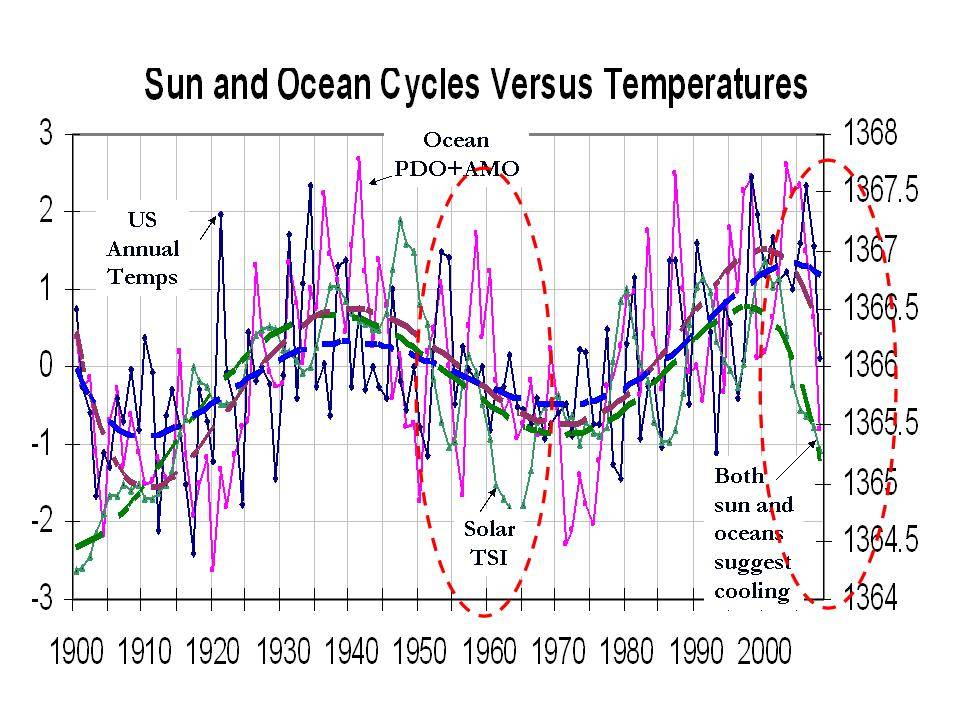
So what has changed? CO2 concentrations continue to increase yet temperatures have been falling since 2002? Polar ice is growing. Storm intensity is in decline. One reason may be that solar activity is at the lowest level in almost a Century. link link link See what the sun looks like with and without sunspots link View today’s photo of the sun and note the continued lack of sunspots link In the past periods with fewer sunspots and lower solar activity were ones with cooler temperatures. It is believed by some scientists that lower solar activity increases cloud formation and this has a cooling effect. If the past is a predictor of the future, these changes in solar activity will cause a 30 year period of cooling temperatures on earth and in fact it appears that this has already begun. See solar activity charts here link
See the combined impact of ocean and solar cycles on global temperatures link
Europe, North America and many other areas of the Earth have recently experienced a score of unusually low temperatures. So where is the global warming that we are preparing for?
Is a carbon cap and trade system that would raise hundreds of billions of dollars each year for the government necessary if in fact the slightly warmer temperatures of 1978-1998 were caused by natural forces such as the Sun’s increased activity in that period, and that many scientists are now becoming skeptical of the theory of man made global warming (AGW)? link It appears to me that this is looking more and more like the Y2K scare of the late 1990s.
If you have doubts about the conventional beliefs of global warming and want to learn more please do read on.
*the use of information on this website is unrestricted and can be reproduced without permission.
Geoff Pohanka
12/10
geoff@isthereglobalwarming.com
To see my presentation in a PDF file with this link
See Geoff Pohanka presentation “Are we at the tipping point?”. link
p.s. If you want to see most of the concepts below about global warming in a single film, then watch this documentary (film)
Climate thought starters
temperature
*For most of the past 10,000 years the earth was warmer than todays temperatures. link
*2000 years of global temperature data, note the current global warming starting in the mid 1700s, well before man started producing much CO2 link
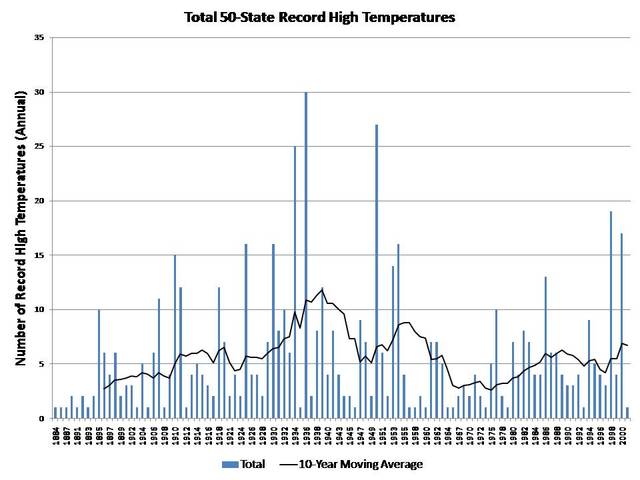
*The warmest year ever recorded in the USA was 1934, link. The coldest, in the mid 1970s, a period when some scientists and most of the press said the earth was heading toward global cooling if not a return of glaciation. link link link link
Warmest years in the USA from 1900 to today according to NASA link 1934 1998 1921 1906 1931 1999 1953 1990 1938 1939
*five of the ten warmest years since 1900 were before 1940!
*the warmest decade was the 1930s link
*US temperatures have only risen .2 degrees F from 1940!
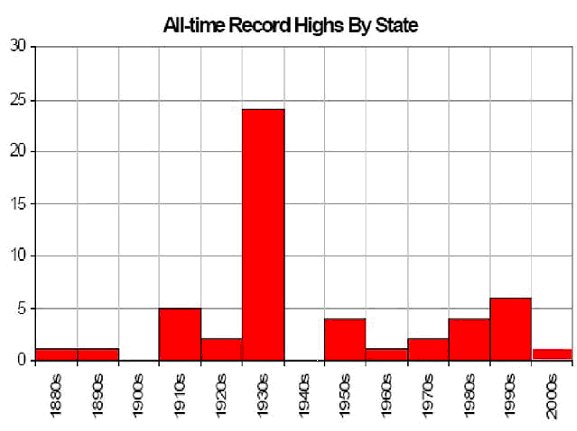
*see how often state’s have set temperature records since 1884 link
*24 of the 50 US States had their highest ever recorded temperature in the 1930s link
*Using just the US rural temperature data (not including temperature sensors near urban areas due to the urban heat island affect), today’s US rural temperatures are cooler than those of the 1930’s. (David Archibald) link
*Global temperatures declined from 1945 through 1979, yet his was a period of rapid industrial expansion and increasing CO2 production throughout the world. If CO2 and temperatures are linked, why did temperatures fall? link
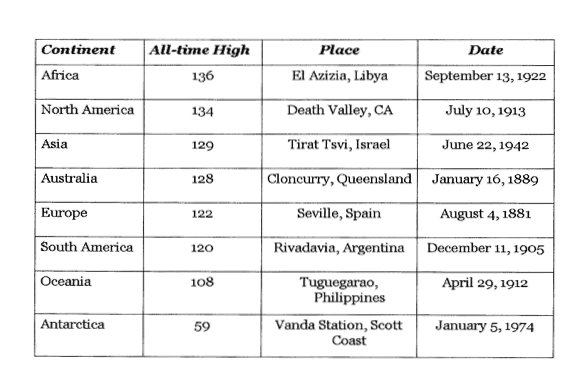
*year of continental record high temperatures:
-
Europe 1881
-
Australia 1889
-
South America 1905
-
Oceana 1912
-
North America 1913
-
Africa 1922
-
Asia 1942
-
Antartica 1974 link
*Global temperatures have declined in five of the last seven decades even though CO2 levels increased throughout this same period.
According to the 351 year temperature record for central England (CET) as maintained by the UK Met Office, England Summer temperatures in the 20th Century were cooler than those of the 18th Century link
*a survey of US weather stations shows that 80% of them are poorly maintained and located and have a warming bias of several degrees due to land use changes. link
*global temperatures mysteriously jumped when nearly 50% of all global weather stations (many in rural areas) stopped recording climate in the early 1990s. link
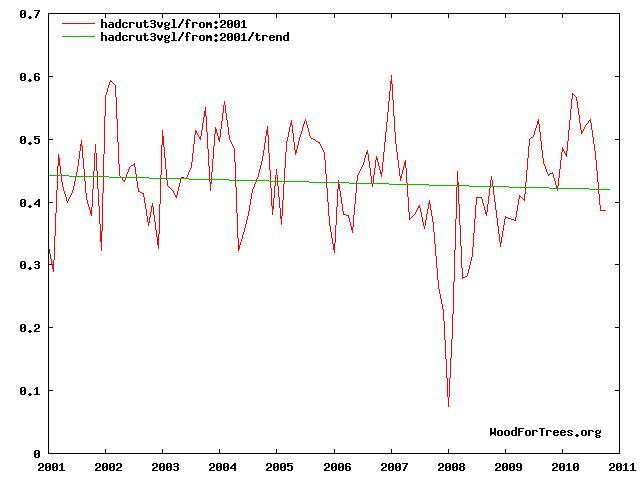
*the 20th Century temperature increase was .6 degrees. In 2007, world temperatures declined .7 degrees according to the 4 most respected sources of temperature tracking, HadCRUTT. RSS. UAH, GISS This is the fastest cooling ever recorded. The 20th Centuries global warming of .6 degrees was reversed in a single year.
*global temperatures have been cooling since 2002 link
*earths temperatures are not constant. There were 23 periods of cooling and warming in the past 500 years with the average cycle being 27 years long. There were two cooling and warming periods in the past 100 years alone. 1880-1915 was a period of cooling 1915-1945 was a period of warming 1945-1977 was a period of cooling 1977-1998 was a period of warming 1998-the present, it has been cooling, all related to changes in solar activity and the Pacific El Nino and La Nina cycles link
Global temperatures today are among the coolest in the last 500 million years link
*The yearly average number of sunspots per year from 1991 through 2007 were 1,361, (according to the S.I.D.C.). Through September of 2008, we are one pace for only 56 sunspots for the entire year. Where is the global warming?
*After the Medieval Period the world cooled 4 degrees centigrade, causing the “Little Ice Age“. This was a period of glacial advance from the mid 1400’s to mid 1800’s. Then the world began to warm once again. Many of the glaciers that are now retreating were ones that grew during this “Little Ice Age”.
*The fastest global temperature change ever recorded was from 1696 to 1732. Temperatures declined 2.2 degrees centigrade, which is 4 times the rate of temperature change and three times the speed of the .6 degree change in temperature of the hundred years of the 20th Century.
*while it is true that there has been some warming in the northern hemisphere in the last part of the 20th Century the southern hemisphere has shown no increase and has actually been cooling. link
*There has been some global warming in the second half of the 20th century but the temperature peaked in 1998 and it has been cooling since. Four of the five most active solar cycles since the 1600’s were in this same period of warming. Active solar cycles historically have caused warming temperatures.
*The winter of 2007-2008 had the most snow cover in North America, Asia, and Siberia in over 60 years.
*China had its worst winter in over 50 years in the winter of 2007-2008 link
*Many areas of the world experienced a harsh winter in 2007-2008. Quite a few had record low temperatures and it snowed in Baghdad the first time in a century (link), and Saudia Arabia experienced the coldest temperatures in 20 years (link)
*CO2 is a trace gas. It is less than 4/100ths of one percent of gases in the atmosphere. link
*of the 186 billion tons of CO2 that enters into the atmosphere yearly only 3.2% is from human activity, the rest is from the oceans, volcanoes, and decaying plant matter. link
*there was 15 times more CO2 in the atmosphere than today during the Ordovician-Sulurian glaciation, 5 times more during the Cretaceous-Jurassic glaciation, and more also during the Permain glaciation. link
*CO2 levels closely follow temperature link
*CO2 concentrations in the atmosphere have been as much as 25 times what they are today. Current CO2 concentrations are among the lowest in the past billion years. link
*atmospheric CO2 is generally much lower than most of the last 500 million years link link
*CO2 is a trace gas, it is less than 4/100’s of 1% of all gases in the atmosphere. Of the 186 billion tons of CO2 that enters the earth’s atmosphere every year only 6 billion tons are from human activity, the rest is from natural causes (decaying vegatation, volcanic activity, and the oceans). Man only contributes 3% of CO2 in the atmosphere. If CO2 truly caused global warming like they say it does there would have been a catastrophe long ago. link
Polar Ice
*Antarctica’s represents 90% of the world’s ice and 70% of its fresh water. Antarctica’s sea ice volume was the largest ever recorded in 2008.
*Antarctic sea ice extent in 2008 exceeded 1979 in ten of eleven months. Average ice extent was over 17% larger than in 1979. Sea ice thickness was also larger. link
*In October and early November 2008 the Arctic sea ice grew at the fastest rate ever recorded (43,804 square miles per day) link
*Arctic Sea ice is increasing at a record rate in 2008, early 2009 link
*While it is true there has been generally less Summer Arctic Sea Ice in the past two decades this loss has been entirely offset by the growth of ice in the Antarctic. When you combine both poles, there has been no net reduction in global ice! link link
*The volume of Antarctic ice in 2008 was averaging one million square kilometers more than normal. Summer ice melt was 40% below the average. link
*The 2008 Summer Arctic ice melt was 9% less than the record of 2007. 1,700,000 square miles of Arctic ice did not melt this year. link
*There is evidence that the Artic sea ice completely melted at least four times before man first walked the earth. Tropical turtle fossils have been found in the Arctic, proving this area was once much warmer than today. link
*On Oct 15, 2008 Arctic sea ice had grown 29% larger than in the previous year. link
*Arctic sea ice was 220,000 square miles larger in Nov ’08 than Nov ’07link
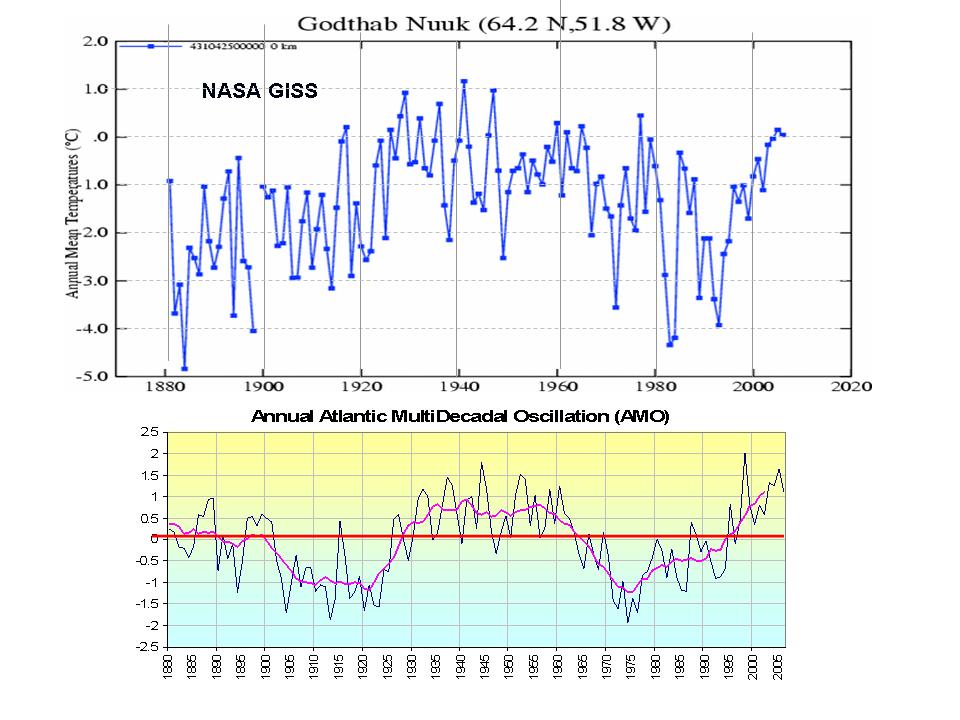
*Greenland’s temperatures today are cooler than those of the 1940’s link NASA GISS link
*recent studies have shown that winds have a larger impact on polar ice formation than does temperature. Changes in winds and sea currents at both poles have caused an increase in ice formation, even though there has not been significant temperature variation in this period. link
Storms
*The number of hurricanes per year that hit the US 1901-1950 were 1.94, and only 1.41 from 1951-2001, 28% less. The 1901-1950 hurricanes were also more powerful on average. But property damage from coastal storms has increased due to over development, higher population density, and falling land levels such as at Galveston TX, where land has sunk over 4 feet due to settling and fossil fuel extraction. (Patrick Michael) Where is the global warming?
Ocean Acidification
What drives the climate?
The Sun is not a constant star, it has cycles that average about eleven years in length. Solar activity is constantly changing. Sunspots are used to measure solar activity since the early 1600s, they have been observed and counted for hundreds of years. Cooling periods on earth have occurred when there were fewer sunspots. Similarly, the earth has warmed (such as the second half of the 20th Century) when there were more sunspots.
The sunspot average from 1900 to 1949 was 576 annually, and from 1950-1999 it was 876, an increase of 52%.
With the current solar cycle the sun has become less active once again with fewer sunspots, suggesting that the long period of warming has come to an end and a period of cooling is beginning (based on a long historic correlation between solar activity and global temperatures).
Solar magnetic activity, as measured by the AP index, in December 2009 was at the lowest level since recording began in 1932.
12/09 NASA announces reduced solar activity is causing the upper atmosphere to cool noticeably
NASA announces that natural, and not man made forces, play a significant role in climate change
NASA, noting changes in the sun, says solar cycle 25 could be the weakest in centuries
9/03/09 NASA, are sunspots disappearing, return of the Maunder Minimum?
NASA solar activity is not constant and is today at the lowest in a century
Ultra long solar cycle 23 and the possible consequences on global temperature (Joseph D’Aleo)
David Archibald: Solar Cycle 24
Impact of solar cycle 23, the longest solar cycle since the early 1800s
Archibald, impact of a very long solar cycle 24, 25 on global temperatures, they will drop 2C
Changes in solar activity have led to cooling temperatures in the past
August 2008, first month without sunspots since 1913, (astrotabletalk)
Finish Physicist Timo Niroma says the Sun’s current activity will lead to a long cooling period
Relationship of solar activity on global climate change (Space and Science Research Center)
Global cooling due to decreased sun spot activity
Henrick Svensmark, new causes of climate change
Daily observation of solar cycle 24
Solar Cycle could be weakest in centuries according to NASA
Causes of global warming and climate change
New York Times October 2, 2008 Fewest sunspots since 1954 (points toward global cooling).
Dr. John R. Christy, global warming, what do the numbers show
Great Global Warming Swindle (UK)documentary
Climate Skeptic, Warren Meyer
part 1 part 2 part 3 part 4 part 5
US Senate Report, scientific studies chill global warming fears
700 international scientists come out against the man made global warming theory
Scientists counter global warming computer models
Princeton physicist Dr. Will Happen calls global warming science mistaken
Solar activity at 8,000 year high, explains recent warming
2008 second lowest solar activity since 1900, explains current cooling
New Little Ice Age instead of global warming. Prof. Theordore Landscheidt
Arctic Sea ice melt linked to changes in solar activity
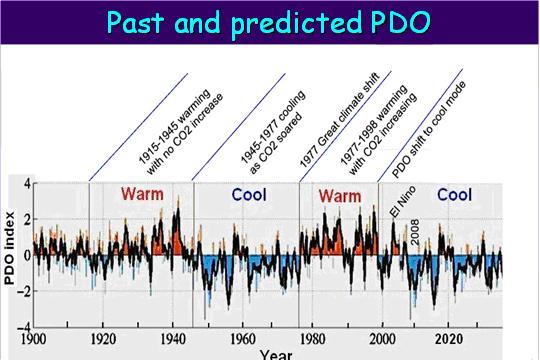
Relationship between solar cycles, PDO and temperatures
Is there scientific consensus in support of man made global warming?
list of 450 peer reviewed papers supporting skepticism of man made global warming
Recent Important Articles
The Earth is never in equilibrium. Linzen
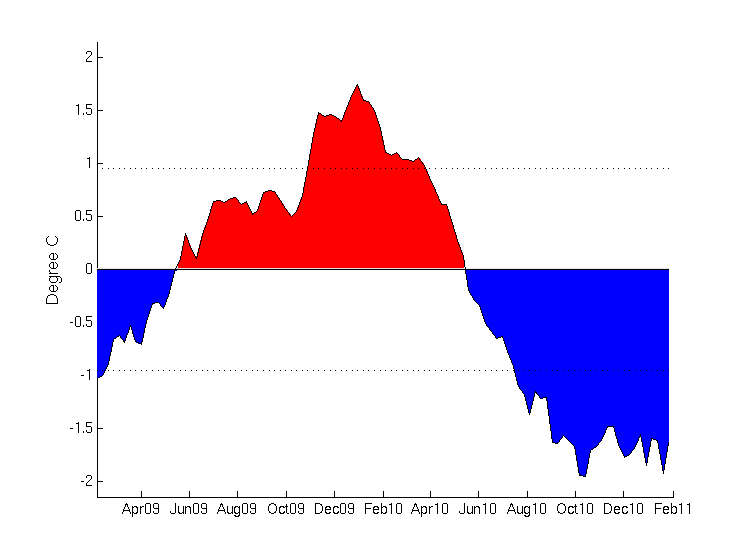
Warm El Nino of early 2010 should change to a cooler La Nina later in the year
Top Russian weatherman says 2009-2010 winter in Siberia may be the coldest ever
Why CO2 does not cause run away global warming
Oceans absorption of CO2 is not shrinking
Lower solar AP index could cause a return of much colder temperatures similar to the Little Ice Age
James Marusek, solar activity is at recorded all time lows
Dr Christy, global warming cure is worse than the problem
Michael Mann’s hockey stick is shown to be wrong
Key data that supports AGW theory is lost? CRUT. Intentionally?
Enjoy global warming while you can
Washington Post, natural causes and not man are responsible for climate change
Huge Texas wind farms can only be relied on for 8.7% of rated capacity
Why Antarctic and Greenland ice sheets are not collapsing
12 facts about global warming you won’t read in the Press, Joe D’Alea
Carbon Dioxide irrelevant in global warming debate, Richard Linzen
Joe D’Aleo, who is making up the facts
Global warming facts and myths
England heading toward power shortages
Australian professor Ian Plimer, its all in the rocks
Richard S. Linzen, The case against precipitous climate action
Government monopsony distorts climate science according to SPPI
Gabriel Calzada, Spain’s efforts to embrace clean energy and create green jobs is a total failure
Whistle blower says EPA endangerment finding is not supportable
Human induced climate change?Ian Plimer part 1 part II part III
The Important role played by clouds the global warming debate
Roy Spenser, A Layman’s Explanation of Why Global Warming Predictions by Climate Models are Wrong
How to talk to a climate skeptic? link link
CO2 can only raise temperatures by 1.2C. Above that it must trigger positive feedback but is this theory plausible?
Why rising CO2 levels can not cause by itself rising temperatures
positive feedback is an important part of global warming fears
Dr. John R. Christy, mankind’s impact on global temperatures and why there is not feedback
400,000 years of Vostok ice core samples show that CO2 did not cause temperatures to change in the past
Temperatures changed before CO2 levels
CO2 follows temperature and not visa-versa
Can the Antarctic and Greenland ice shelves collapse?
Scientists find water under the antarctic ice shelves is not warming
Is global warming really all that bad?
The medieval warm period was a very prosperous time for the Incas, Ottomans, and Ming Dynasty
Global warming played a role in the Incas rise
Proof of the Medieval Warm period and why the warming was global
Roman Period was warmer than today
Why Micheal Mann’s famous hockey stick was discredited
Are the NASA GISS global temperature records correct?
NASA estimates many temperatures where sensors do not exist, this overstates warming
Al Gore to benefit financially from CO2 controls.
How much is he influenced by the potential for huge financial gains from CO2 controls?
Al Gore makes millions from investments in government subsidized companies
Problems with Al Gore’s”Inconvenient Truth”
Air pollution in the United States has been reduced substantially since 1980
US air pollution levels have declined even though population is growing rapidly
Polar ice, is it melting? links:
Loss of Arctic ice was due to winds and not directly to global warming
Arctic temperature changes more closely linked to solar changes than changes in CO2
There is no net melting of polar ice when both poles are added together (Steven Goddard)
Polar sea ice rebounds to 1979 levels according to the Illinois Arctic Climate Research Center
NASA, rate of ice melt in Greenland will raise oceans only 1.4 inches in the next century
Greenland’s glacial melt along the ocean is offset by record snows in the interior
How high would the seas rise if ice on Greenland and Antarctica melted?
What was the Little Ice Age from 1650 to 1830?
Wm Robert Johnson, “what if all the ice melts? Myths and realities
Greenland’s ice is not melting
Chart that tracks the growth in Antarctic sea ice
History of ice ages and warming
Most ice between Greenland and Canada in fifteen year
Is Greenland’s ice melting?
Growing in the middle, melting on the edges
Glaciers can melt due to other reasons than global warming
Bolivia’s Chacaltaya glacier is melting even though temperatures have cooled
Polar Bear population is growing and is at or near an all time record size, up to 5 times more bears than the 1950s. Links:
Polar Bear population growing rapidly
Polar Bear population reaches record high in 2008, 5 times more bears than the 1950’s
Polar Bear populations are not endangered
Polar Bears are powerful swimmers
The Latin name is “Ursusus Maritimus” sea bear. Polar Bears can swim 200 miles or more
Interesting facts about Polar Bears and global warming
What is Carbon Cap and Trade?
What are the costs of cap and trade
Carbon trading unintended consequences, people losing homes in China
Are climate forecasting models accurate?
Forecasting guru states there is no scientific basis for forecasting climate (Scott Armstrong)
UN IPCC climate models are not accurate
Problems with Manns ‘hockey stick” Michael Crichton
EPA, impact of urban heat islands on temperature measurement
Does changing solar activity impact cloud formation and thus temperature?
Impact of cosmic rays on climate
Cosmic ray impact on cloud formation and temperatures Ken Gregory
Henrik Svensmark, impact cosmic rays on cloud formation
University of Alabama Huntsville, clouds appear to be a negative feedback, not positive
Solar activity is driven by the Sun’s internal magnetic field
What is the relationship between historical rises in temperature and CO2?
Environmental effects of increased atmospheric carbon dioxide, by Robinson and Soon
top 15 global warming climate myths
CO2, temperature, and ice ages
Does rising CO2 levels cause temperature increases or visa-versa
Christopher Monckton (former adviser to Margaret Thatcher) comments on the AGW theory
California brush fires and global warming
Impact of La Nina and El Nino on california fires
How temperatures are collected impacts the data. The decline in rural stations and temperature averaging makes it seem that temperatures are increasing when they are not
Joe D’Aleo article on how temperature is collected
Land based temperature sensors encroached by urbanization, give false data about temperature increases.
Temperature sensor located next to A/C units and temperatures rising as a result
The USA has the longest record of temperature tracking since 1900
EPA explains the impact of the Heat Island Effect on temperature measurement
Are the globe’s forests in decline?
Eastern US trees growing at the fastest rate in 225 years
Global green areas have grown 6% from 1982 to 1999
Rain forest is growing faster than trees can be cut down
Rain forests growing back, new growth consumes more CO2 than old growth
England to have the most forest in 1,000 years
US hardwood forests have doubled in the last 50 years
Can wind and solar power replace conventional energy systems? link
UK wind farms are called subsidy farms by some
UK wind farms operating at less than twenty percent of capacity
UK wind farms produce almost no power during the December-January cold snap due to lack of wind
Texas wind farms can only provide 8.7% of rated capacity
Wind power can supplement but not replace fossil fuels
Spanish “green jobs” economy a failure with 18% unemployment
The low benefit of industrial wind, Eric Rosenbloom
Problems with wind power, is it the solution for global warming
Renewable energy, wind and tide, is not reliable, will not help with global warming
Wind power is not free and has ecological costs
growing wind farm health problems
Denmark wind farms unintended consequences
Wind power is a complete disaster
England heading toward power shortage as fossil fuels and nuclear are phased out
Greenjobs
90% of UK energy investment goes to firms outside of the country
Spain’s challenges with the cost of greenjobs
The effect on developing nations with control of CO2
Half the words population is without electricity and need fossil fuels to move out of poverty
Will CO2 cause the the oceans to become acidic? Will coral reefs be impacted by higher CO2 levels?
Ocean life can adjust to changes in ocean acidity
There is not enough fossil fuels on earth to make the oceans acidic Ian Plimer
Oceans will not acidify due to higher atmospheric levels of CO2
Ocean life benefits from higher levels of CO2 (Roy Spenser)
How long does CO2 stay in the atmosphere?
IPCC overestimates how long CO2 remains in the atmosphere
Ocean temperature and climate
Solar cycles tied to ocean temperature changes
Ocean heat flow not connected to CO2 levels.
Both cooling and warming periods on earth are closely linked to ocean temperatures
3/08 NASA scientists are puzzled why the oceans are cooling
NASA discovers that ocean temperatures cooling since 2003, trend is ‘unprecedented’
Oceans cooling since 2003, maps
Oceans rising for 20,000 years
See current Atlantic Storm activity
Will the oceans rise 20 feet in the 21st Century like Al Gore says it will?
Scientists say the seas wont rise
Are the Pacific Islands threatened by sea rise from global warming?
Dr. Vincent Gray says the Pacific sea islands are not threatened by sea level rise
Letter of the Viscount Monckton of Breshley to John McCain, why the global warming theory is false link
Why isn’t the upper atmosphere warming? Links
Is the warming on Venus due to CO2 high concentrations?
Venus is much warmer than earth because of its thicker atmosphere, not CO2 levels
The atmosphere in Venus is 92 times thicker than earth’s and the CO2 level is 2,500 times higher.
Al Gore compared the atmosphere on Venus to Earth but there are many differences
If the CO2 warming theory is correct, what is so unnatural and why do we need to change society to deal with it
Adjusting to change is more effective
Will taxes rise with cap and trade legislation? link
Results of UK climategate investagatgion
Joe D’Aleo and Pat Michaels presentation about the climategate e-mails
IPCC
One of IPCC’s primary sources of data is proven to be false, cherry picked data
Problems with IPCC conclusions about man made global warming
Maximum residence time of atmospheric CO2
Counter points to IPCC climate predictions
Dr. Vincent Gray challenges panel findings on global warming
Less than 20% of IPCC members had any prior experience with the climate
No IPCC members are sea level scientists
IPCC climate models are not accurate
The impact of CO2. Links:
Negatives of CO2 are overstated, Art Horn
plants grow more quickly with rising CO2 levels
Theory of CO2 causing warming was debunked 100 years ago
Life flourished with high CO2 levels
CO2 is less than 4/100s of 1% of all gases present in the atmosphere (Monte Hieb)
Plants can grow up to 50% faster with CO2 levels of 1000 ppm
Atmospheric CO2 levels today are among the lowest in the last 600 million years
CO2 is essential to the survival of plants and humanity
Are global deaths due to storms increasing?
Global deaths and death rates from storms are decreasing
Global hurricane activity is at a 30 year low link
Facts about alternative Energy sources
Spanish “green jobs” economy a failure with over 18% unemployment
Wind farms results not promising in Europe
Solar panels have a 100 year plus payback but only last 20-25 years.
Global Warming in perspective. Links:
The science of global warming in perspective
American Thinker, global warming-bring it on
Man only accounts for .28% of the greenhouse effect, water is the largest greenhouse gas by far
12 facts about global warming that you won’t read in the popular press (Joseph D’Aleo)
You tube global warming causes everything
Other climate resource links:
watts up with that (Anthony Watts)
popular technology climate links
things caused by global warming supposedly
Oleg Sorokhtin, Soviet scientist observes global cooling
53 skeptical arguments against global warming
2008 International Conference on Climate Change, NY NY March 2007 (here are the scientists)
Famous French scientist becomes a global warming skeptic
Weather Channel founder blasts global warming scare
Growing list of Scientists who are now skeptical of man made causes of global warming
The politics of Climate Change. Misc links:
Sharp Americans are starting to understand H.L. Mencken’s observation that “The urge to save humanity is always a false front for the urge to rule it.”
Interesting story from Freakconomics, authors are attacked
Irish politician bans global warming commercials, says they are propaganda
Liberal blogs, press, and scientists coming out against the AGW theory
1970’s global cooling scare, media said earth was heading toward another ice age
2008, a bad year for global warming. Michael Fox
Czech President says AGW is a myth
Media bias toward man made global warming
12/31/08 UK Environmental Minister Sammy Wilson declares man-made climate change is a “con”
CNN meteorologist Chad Meyers calls theory of man made global warming “arrogant”
12/16/08 scientists call AP report on global warming hysteria
Global warming supporters are similar to weather worshipers
truths about climate change are being ignored. Scientists are chasing recognition and funding
Climate Distortion of US energy policy, S. Fred Singer
NIPCC, Nature, not human activity, rules the climate, S. Fred Singer
Washington Post, too many things are blamed on global warming
Global Warming advocates may suffer from cognitive dissonance
link to sister site www.isthereglobalwarming.com
Fake but accurate, some global warming advocates hold to their beliefs even when proven wrong
Some blame the Little Ice Age on mankind
OT-810

BILLIONS WILL BE ………TROUSERED BY….IN THE NAME OF GLOBAL WARMING?
LETS GUESS!
A superb and a very comprehensive presentation.
Concerning: What drives the climate? Leonardo da Vinci (1452-1519) is said to have assumed that: “Water is the driver of nature”. http://www.oceanclimate.de/Archiv/juni_08.html.
I suggested many years ago (1992) to acknowledge that
“Climate is the continuation of the ocean by other means”, http://www.whatisclimate.com/1992-nature.html ,
whereby means mean: water vapor, heat and many other aspects.
And the sun? The sun is the most important factor to set the system in motion, and any sun cycles will be reflected in the earth system via the heat storage of the ocean, but great shifts on Earth are internal matters, particularly ocean related issues. With an average temperatures of mere 4°Celsius, a Little Ice Age can commence within a few months. Stood the start of the global cooling from 1940 t0 1970, in any casual link with the naval warfare of WWII? http://climate-ocean.com/ Presumably we would know about the mechanism of a cooling period much more if such a historical event would be properly understood.
Arnd Bernaerts
We can feel the climate cooling no matter what Politicians say.
Throwing any amount of money at climate change will change nothing apart from making Western tax payers poverty striken!
The UK sent approx 47 delegates to Mexico then use the FOI act to hide the cost- akin to allowing only pro global warming scientists to comment- ALL TOO DODGY!
We may not have scientifc minds but we know when we are being fed crap!
Cheers for your links……….
„Who Rules the Climate”?
– By Oceanclimate, 05 June 2008 –
When it comes to the term CLIMATE, the friends of IPCC[1], as well as their foes, are happily sailing in the same boat. While fighting a war of arguments how climate works, or may change, and what counter measures should be taken at many Billions costs, the global politics, and scientific community feel comfortable to talk about CLIMATE. Commonly it is said that ‘climate is the average weather’[2], without saying how ‘weather’ should be defined in the first place. As “climate means so many things to different people”[3], the climate & weather issue is discussed elsewhere (here). As a matter of fact, the whole climate change debate is not based on sound terms. but on a wild guessing what CLIMATE may be. Even the relevant global Convention on Climate Change, 1992, (UNFCCC) has none[4].
„Nature, Not Human Activity, Rules the Climate” ?: Recently a group of about 30 well reputed scientists, headed by S. Fred Singer, took on to challenge the findings of the main stream supporters of CO2 induced global warming by their paper: „Nature, Not Human Activity, Rules the Climate“[5] criticizing the principal IPCC conclusion “that the reported warming (since 1979) is very likely caused by the human emission of greenhouse gases”. While the two camps of supporters and skeptics fight a fierce battle on ‘right and wrong’, they sail mutually through tricky waters without knowing what CLIMATE is. The Singer et al. work is a good example, as the paper’s title is grossly misleading, if not erroneous.
“Water is the driver of nature”!: When Singer et al. imply that: ‘nature rule the climate’, they are in full agreement with IPCC scientists and the UNFCCC, which uses the term ‘climate system’ (see FN 4, para. 3).
All that this boils down to is ‘the interactions of the natural system’. What is the point of a term if it explains nothing, said a letter to NATURE back in 1992 already. But neither the United Nations, nor IPCC, nor Singer et al. see it and undertake any efforts for rectification. As this situation turns out to be a gross disservice to the global society, the world might have been better served by some historical persons who seem to have had a better insight in the global system, for example by Leonardo da Vinci (1452-1519): “Water is the driver of nature”.
Water rules nature!: Not nature rules climate, but water rules the nature on this earth. Water is the essence of anything that makes the earth special, as a brief comparison with the moon quickly shows. Earth’s water volume is to 97% contained by the oceans, which have an average temperature of just ca. 4 degrees. Only their huge storage of heat and water supply to the atmosphere make climate – although variable –, and life on earth possible. Climate would not exist, and could not work without water.
Climate is the continuation of the oceans by other means: The overriding effect of the oceans rectify this definition for CLIMATE. It would bring the focus to the backbone of the climate system. At least the general public would understand for what the term CLIMATE stand for. Once adopted it would presumably lead quickly to the understanding of the two major climatic shifts during the last Century, namely the early arctic warming that started in winter 1918/19, and the global cooling that started in winter 1939/40 lasting for three decades.
——————————————————————————–
[1] IPCC, Intergovernmental Panel on Climate Change, http://www.ipcc.ch/ .
[2] WMO, Frequently Asked Questions (FAQs), http://www.wmo.ch/pages/prog/wcp/ccl/faqs.html
[3] Carl Wunsch, 1984, “The ocean circulation in climate”, in: John T. Houghton (ed), The Global Climate, Cambridge, p.189, 190.
[4] United Nations Framework Convention on Climate Change, 1992; but defines instead in Article 1 the following terms:
1. “Adverse effects of climate change” means changes in the physical environment or biota resulting from climate change which have significant deleterious effects on the composition, resilience or productivity of natural and managed ecosystems or on the operation of socio-economic systems or on human health and welfare.
2. “Climate change” means a change of climate which is attributed directly or indirectly to human activity that alters the composition of the global atmosphere and which is in addition to natural climate variability observed over comparable time periods.
3. “Climate system” means the totality of the atmosphere, hydrosphere, biosphere and geosphere and their interactions.
[5] Singer, S. Fred (ed); (2008), „Nature, Not Human Activity, Rules the Climate“; © 2008, Science and Environmental Policy Project / S. Fred Singer; Published by THE HEARTLAND INSTITUTE, http://www.sepp.org/publications/NIPCC_final.pdf .
http://www.oceanclimate.de/Archiv/juni_08.html.
OK, let us take this a bit further. For most of Earth’s history, roughly 80% or so, occurred during an ice age. The other 20% occurred as interglacial periods. So, for planet earth, ice rules the world more often than water. So, when the average annual global rainfall goes below 65 cm, a new ice age may emerge. There won’t be enough warm moisture to prevent a global snowball like formation of upper atmospheric ice crystals called diamond dust. I think average global rainfall is somewhere around 99 cm. at present. Who knows for sure?
Good Source of stats etc..
Quick facts about the US and global climate
U.S. and global Temperatures are cooling
*October 2009 U.S. temperatures according to NOAA were the third coldest in 115 years of record keeping, 4 degrees below the average temperature for this month. link October 2009 also had the most snow in the U.S. than has ever been recorded for that month.
*Germany recorded in 2009 its lowest October temperature in history link. New Zealand had record low October temperatures and record late snows link China had the worst October snowstorms in recorded history, 40 people died and over 9,000 buildings collapsed link
Siberia may have had its coldest winter in history in 2009-2010 link European and Asian temperatures in the winter 2009-2010 were well below normal link
*October 2008 to January 2009 temps were well below normal link According to the NCDC U.S. temperatures in October 2009 was on average the third coldest in 116 years, November was the 4th coldest, and February 2010 was the 29th coldest. U.S. temperatures December ’09 – February ’10 were well below normal link. UK experiences coldest May temps in 15 years link U.S. temps Nov ’09 to May ’10 remain mostly below normal link , October ’09 through March ’10 was the snowiest on record in the northern hemisphere link
*In the U.S. temperatures cooled in five of the last seven decades even though CO2 levels increased steadily throughout this period. link link
*In February 2010 the Northern Hemisphere had the second largest area of snow coverage ever recorded link and North America had the most snow cover ever recorded. Snow coverage in the Northern hemisphere has been growing since 1998 link. Snow in areas where it usually does not snow can only be because temperatures are colder, and not from global warming link The additional snow was not because of higher levels of humidity, according to NCDC February ’10 was the 47th driest in 116 years.
July 2010, South America experiences historic cold weather link Argentina experiences coldest winter in 40 years link
Record Summer 2010 cold in Australia link
Cold weather kills 600 rare Penguins in South Africa link
In spite of all the hot weather of late, according to NOAA 62% of the continental U.S. had below normal temperatures January-July 2010 link
August 2010, hundreds die in Peru from record cold link October 2010, hundreds of thousands of sheep die in New Zealand from winter weather link
Early December snow (2010) impacts millions in Europe link Denmark experiences coldest November 2010 temps in 131 years link Sweden braces for coldest November 2010 temperatures in over 100 yearsl link UK midlands expect coldest November temps in 134 years link
The central England temperature record in early December 2010 was the second coolest since records began in 1649 link UK experiences coldest December in history link
UK is paralyzed by December blizzards. Only essential travel allowed. link
December 2010 near record cold in Europe, India, and Asia link
7,000 buffaloes die from cold in Vietnam link Bitter cold sets records in Korea, Jan ’11 link 800,000 animals lost from cold in Mongolia link Snow flattens 100,000 homes in China link
The best and most accurate way to measure global temperatures are from satellites that measure atmospheric temperatures. See how atmospheric temperatures have changed since the start of measurement in 1979 link
http://www.isthereglobalcooling.com/